
Income Statement
Here’s the financial performance of our company for the years 2018, 2019, and 2020. The table below outlines key figures such as sales, gross profit, operating expenses, and net income.
| Year | Sales | Cost of Goods Sold | Gross Profit | Operating Expenses | Operating Profit | Net Interest | Profit Before Taxes | Taxes(40%) | Profit After Taxes | Dividends | Retained Earnings |
| 2018 | $30,000,000 | $16,000,000 | $4,000,000 | $2,000,000 | $2,000,000 | $44,000 | $1,956,000 | $782,400 | $1,173,600 | $588,000 | $590,500 |
| 2019 | $32,000,000 | $17,000,000 | $5,000,000 | $2,300,000 | $2,700,000 | $50,000 | $2,650,000 | $1,060,000 | $1,590,000 | $600,000 | $990,000 |
| 2020 | $35,000,000 | $18,500,000 | $6,000,000 | $2,500,000 | $3,500,000 | $55,000 | $3,445,000 | $1,378,000 | $2,067,000 | $700,000 | $1,367,000 |
Retained Earnings Growth (2018–2020)
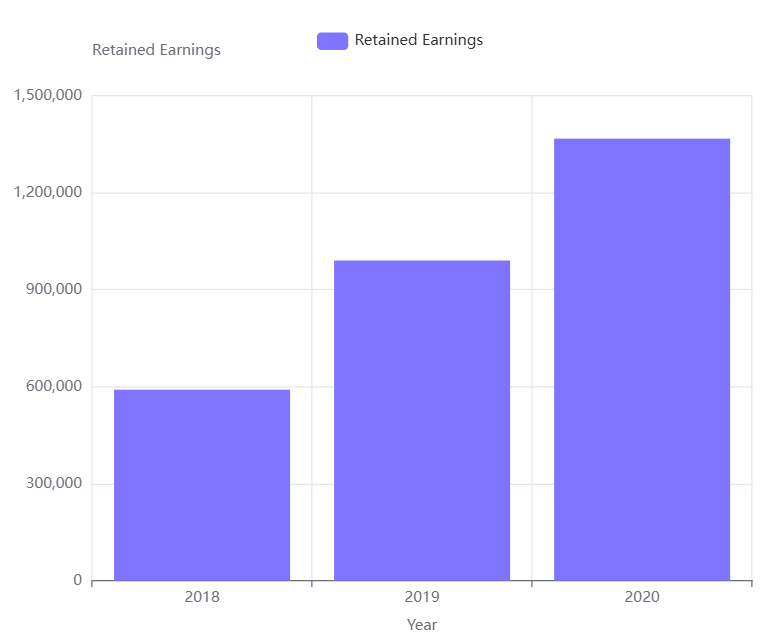
This bar chart illustrates how retained earnings have increased over time, reflecting solid reinvestment strategies and strong post-tax profits.